
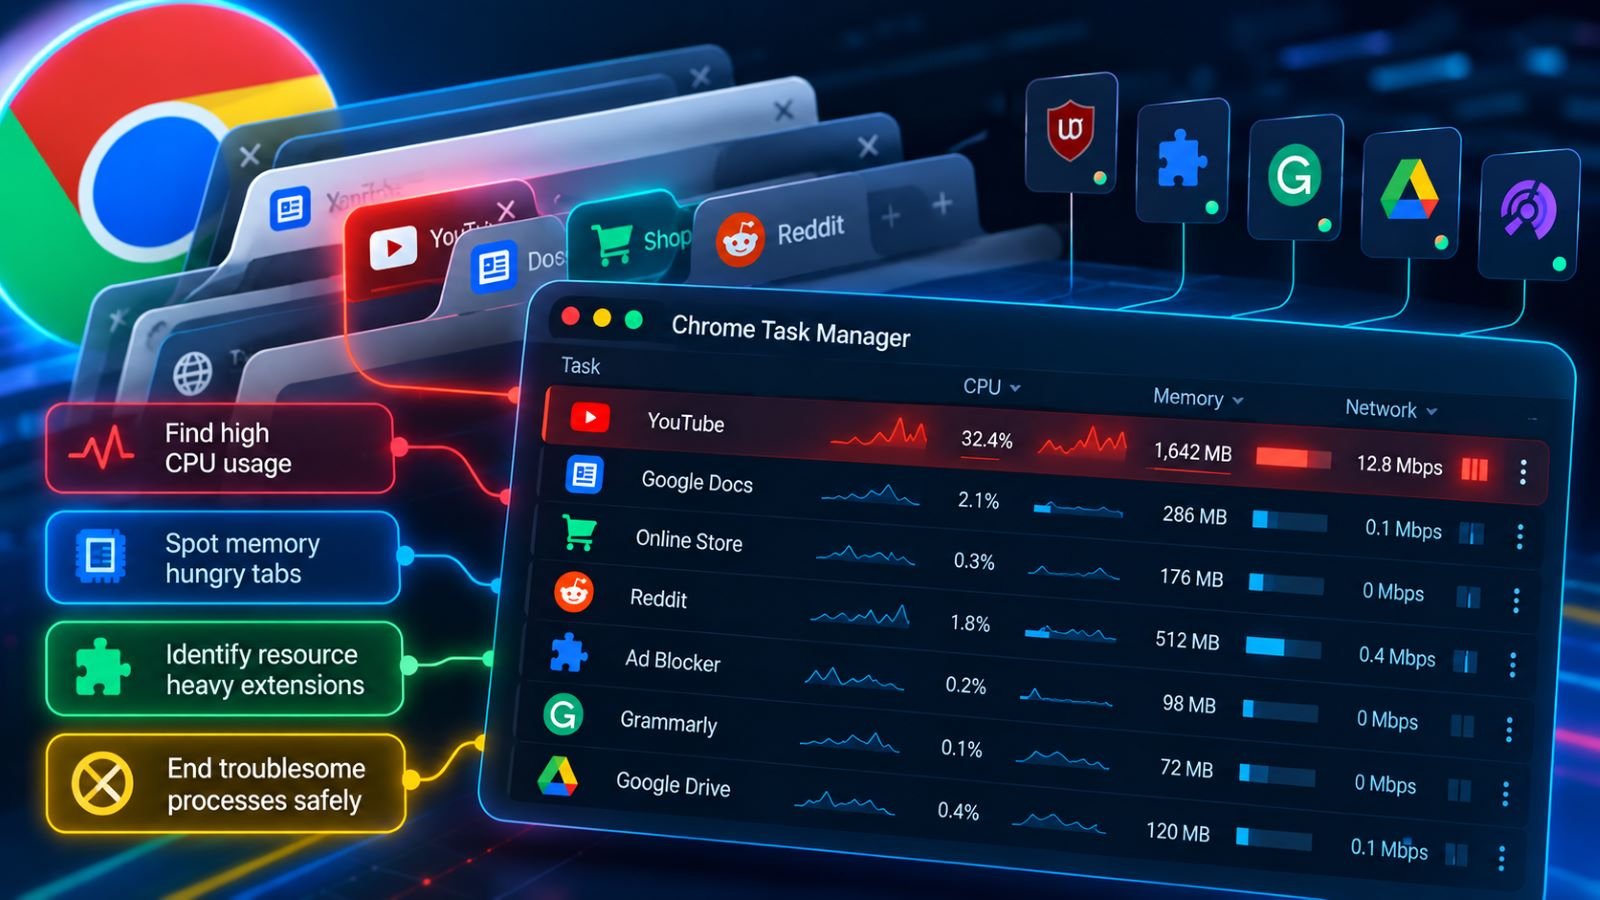
Chrome Task Manager helps you identify which tabs, extensions, and browser processes are using resources when Google Chrome slows down. It can reveal sustained CPU activity, unusually high memory usage, or an unresponsive task without requiring you to close the entire browser. The goal isn’t to terminate the largest process on sight; it’s to find a likely cause and make a targeted change. This built-in desktop tool needs no additional extension or download.
How to Open Chrome Task Manager
In desktop Chrome, open the three-dot menu in the upper-right corner, choose More tools, and select Task manager. The window lists browser tasks and their resource readings, including open pages and extensions. This menu route works on Windows, macOS, and Linux.
The Chrome Task Manager shortcut on Windows and Linux is Shift + Esc; press it while Chrome is active. Google’s Chrome keyboard shortcuts document this combination under Windows and Linux, but not under Mac shortcuts. On a Mac, use the Chrome menu instead of assuming the Windows shortcut applies. On Chromebooks, Search + Esc opens the ChromeOS Task Manager; troubleshooting ChromeOS tasks is a separate topic.
If Chrome’s interface is completely frozen, its own Task Manager may not open. In that situation, use an operating-system tool to assess whether the entire browser is unresponsive rather than repeatedly clicking the menu.
How to Read CPU, Memory, and Network Usage
The Task column identifies pages, extensions, and supporting browser processes. Memory footprint indicates RAM attributed to a task, while CPU reflects processing activity. Network shows traffic associated with a task; a higher reading may be normal during a download or video stream. Process ID distinguishes similarly named entries, although most troubleshooting doesn’t require it.
Click a column heading to sort the list. Sort by CPU when Chrome has high CPU usage, fans run loudly, or pages stutter; sort by memory when many tabs have been open for hours. Watch the readings before acting. A page loading new content may briefly use substantial resources and then settle down, whereas an inactive task that remains unusually busy merits investigation.
A browser game or video editor may reasonably need far more memory than a simple article page. Similarly, network traffic measures activity, not how quickly a website responds. Chrome’s per-task memory figures aren’t a complete measurement of the computer’s RAM pressure, so use a system-level tool if other applications are slowing down too.
How to Identify a Slow Tab or Extension
Start with one symptom you can reproduce. For example, perhaps scrolling becomes jerky only when a particular dashboard is open, or Chrome slows down immediately after an extension update. Leave the affected page open, launch Chrome Task Manager, and sort the relevant column to see which task stays near the top.
Use the task names to narrow your search, but don’t assume every process corresponds to exactly one tab. An extension may appear under its own name, and some browser processes support several pages or components. Google’s Chrome performance advice recommends inspecting resource-hungry tasks and disabling extensions you no longer need.
| Symptom | What to Check | Next Action |
|---|---|---|
| One page freezes | The affected tab’s task, even when CPU usage is low | Wait briefly, then consider ending the affected task |
| Chrome uses too much RAM | Which tabs and extensions have large memory footprints | Close unneeded tabs or try Memory Saver |
| Slowdown began after an extension change | Extension task active when the problem occurs | Disable that extension and repeat the test |
| Every tab is sluggish | Browser-wide activity and system memory pressure | Check the operating system before blaming one page |
If an extension appears to consume unusual CPU or memory, open chrome://extensions and switch it off temporarily. Repeat the action that caused trouble, then re-enable the extension if it’s safe to test whether the slowdown returns. This isolates a likely cause without changing your entire browser setup at once.
How to End a Chrome Process Safely
Use End process for a frozen or clearly misbehaving task, not simply because it has the highest memory reading. It may discard unsaved form entries, interrupt uploads, or disconnect a call. Because some processes can be shared, save important work in other tabs before proceeding when possible.
- Open Chrome Task Manager and locate the task associated with the problem.
- Confirm that its name or behavior matches the frozen tab or suspected extension.
- Select that task and click End process.
- Return to the affected tab, reload it if needed, and check whether the issue returns.
Avoid ending entries such as Browser, GPU Process, or unfamiliar utility services simply because their numbers are high. They can support several tabs or browser functions, so stopping them may disrupt unrelated activity. Google warns that End process can lose unsaved work; if a page is still making progress, waiting may be safer than forcing it closed.
If the task immediately reappears and the problem comes back, treat that as a clue. The website, extension, or browser configuration still needs attention; repeating End process indefinitely won’t solve it.
Why Chrome Shows Multiple Processes
Chrome deliberately separates different kinds of work. Webpage rendering, extensions, graphics acceleration, and browser services may run in distinct processes, which helps prevent a failure in one area from taking down the entire browsing session. Site isolation also separates content from different websites for security reasons.
Five open tabs can therefore produce substantially more than five Task Manager rows. A page containing content from another website may require an additional renderer, while related pages can sometimes share one. Process count alone isn’t evidence of a memory leak or malicious software.
Chromium’s multi-process architecture overview explains the design. For troubleshooting, focus on tasks with sustained, unexplained activity rather than attempting to minimize the number of processes. A higher process count can be the normal cost of keeping different sites isolated.
Chrome Task Manager vs. Windows Task Manager
Chrome Task Manager answers a browser-specific question: which tab, extension, or internal task is using resources? Windows Task Manager shows the broader picture across applications and background processes. When just one page misbehaves, Chrome’s task names usually make it easier to investigate without terminating the whole browser.
If Chrome and other applications are slow, open Windows Task Manager to compare total CPU, RAM, and disk activity. For launch shortcuts and system-wide performance checks, see how to open Task Manager in Windows 11 and Windows 10.
On macOS, Activity Monitor provides the comparable system-wide view. Neither operating-system utility is a direct replacement for Chrome’s task list, and ending the entire Chrome application may close or disrupt far more than the troublesome page.
What to Do If Chrome Is Still Slow
If Chrome Task Manager doesn’t solve the slowdown, update Chrome and restart the browser normally. Then test the same website with unnecessary extensions disabled. When the problem happens on only one site, try another site under similar conditions before changing browser-wide settings; its scripts, advertisements, or server response may be responsible.
For persistent memory pressure, open Chrome Settings, choose Performance, and review Memory Saver. It deactivates eligible inactive tabs and reloads them when you return. Google provides Moderate, Balanced, and Maximum levels, with shorter periods before deactivation at higher settings. Add an essential web app to Always keep these sites active if it needs to maintain background state. Google’s Chrome performance settings explain these options and their exceptions.
Memory Saver is not a universal cure for CPU spikes. An active video call, a poorly behaving extension, or an issue with graphics acceleration may require a different investigation. If the slowdown affects several applications, check free disk space, available RAM, background system tasks, and whether an operating-system update is running.
After restarting Chrome, restore a few tabs first and watch how the browser responds. Reopen the rest gradually if the slowdown does not return. The goal is to identify the source of a recurring problem, not just to make the resource numbers drop temporarily.